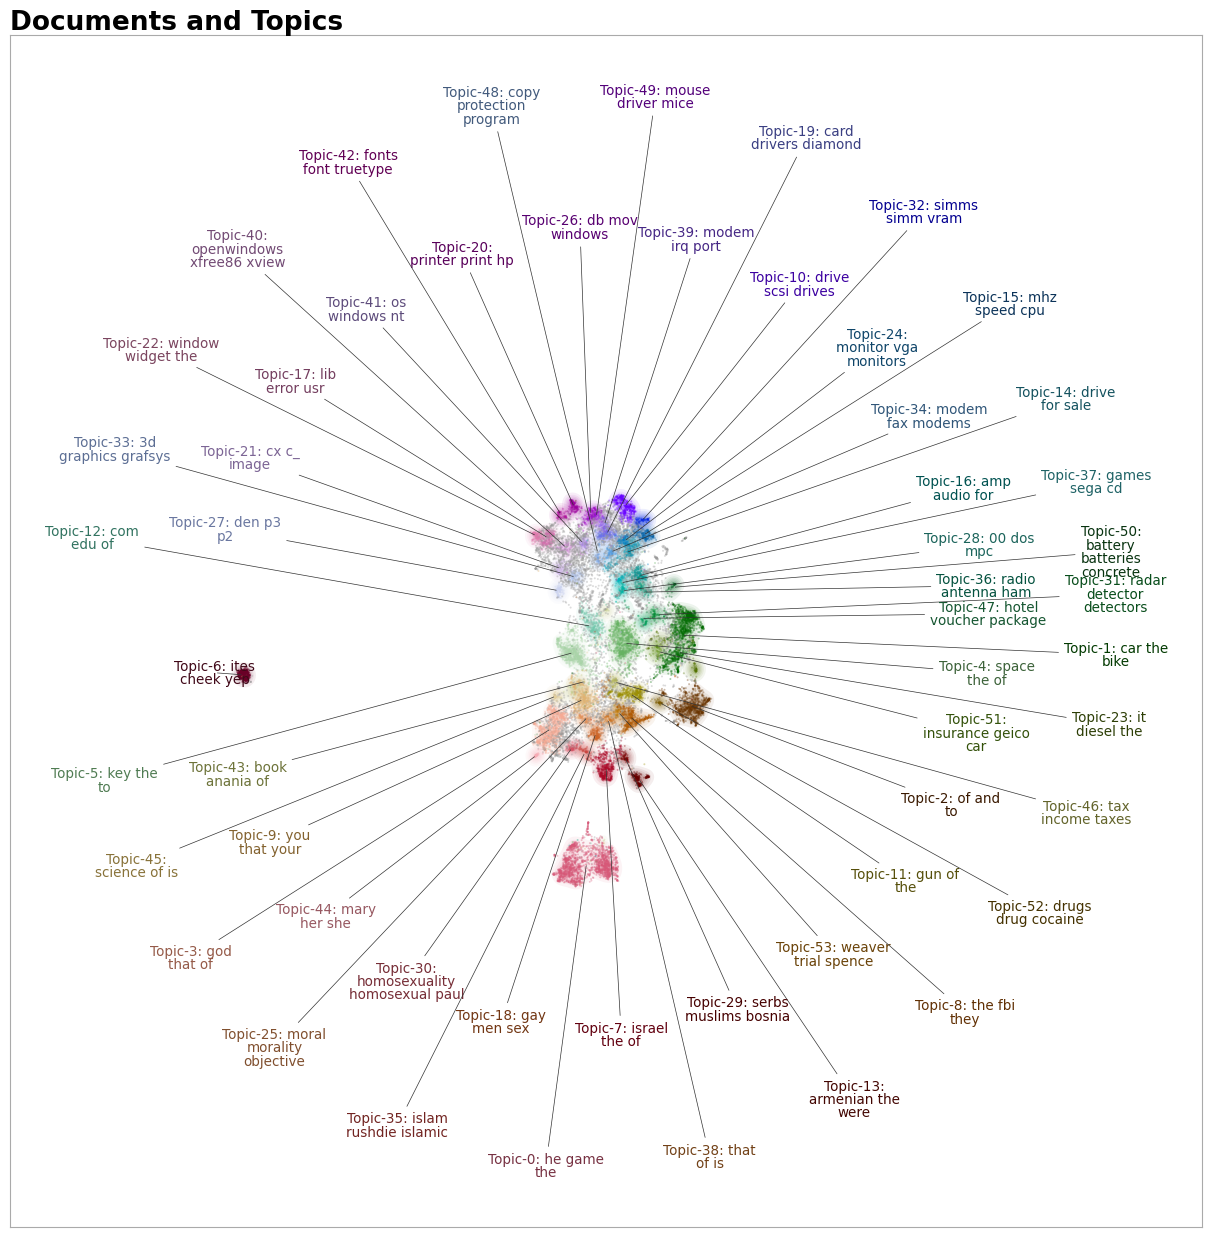
Documents with DataMapPlot
Visualize documents and their topics in 2D as a static plot for publication using DataMapPlot.
Parameters:
| Name | Type | Description | Default |
|---|---|---|---|
topic_model
|
A fitted BERTopic instance. |
required | |
docs
|
List[str] | None
|
The documents you used when calling either |
None
|
topics
|
List[int] | None
|
A selection of topics to visualize.
Not to be confused with the topics that you get from |
None
|
embeddings
|
ndarray
|
The embeddings of all documents in |
None
|
reduced_embeddings
|
ndarray
|
The 2D reduced embeddings of all documents in |
None
|
custom_labels
|
Union[bool, str]
|
If bool, whether to use custom topic labels that were defined using
|
False
|
title
|
str
|
Title of the plot. |
'Documents and Topics'
|
sub_title
|
Union[str, None]
|
Sub-title of the plot. |
None
|
width
|
int
|
The width of the figure. |
1200
|
height
|
int
|
The height of the figure. |
750
|
interactive
|
bool
|
Whether to create an interactive plot using DataMapPlot's |
False
|
enable_search
|
bool
|
Whether to enable search in the interactive plot. Only works if |
False
|
topic_prefix
|
bool
|
Prefix to add to the topic number when displaying the topic name. |
False
|
datamap_kwds
|
dict
|
Keyword args be passed on to DataMapPlot's |
{}
|
int_datamap_kwds
|
dict
|
Keyword args be passed on to DataMapPlot's |
{}
|
Returns:
| Name | Type | Description |
|---|---|---|
figure |
Figure
|
A Matplotlib Figure object. |
Examples: To visualize the topics simply run:
topic_model.visualize_document_datamap(docs)
Do note that this re-calculates the embeddings and reduces them to 2D. The advised and preferred pipeline for using this function is as follows:
from sklearn.datasets import fetch_20newsgroups
from sentence_transformers import SentenceTransformer
from bertopic import BERTopic
from umap import UMAP

# Prepare embeddings
docs = fetch_20newsgroups(subset='all',  remove=('headers', 'footers', 'quotes'))['data']
sentence_model = SentenceTransformer("all-MiniLM-L6-v2")
embeddings = sentence_model.encode(docs, show_progress_bar=False)

# Train BERTopic
topic_model = BERTopic().fit(docs, embeddings)

# Reduce dimensionality of embeddings, this step is optional
# reduced_embeddings = UMAP(n_neighbors=10, n_components=2, min_dist=0.0, metric='cosine').fit_transform(embeddings)

# Run the visualization with the original embeddings
topic_model.visualize_document_datamap(docs, embeddings=embeddings)

# Or, if you have reduced the original embeddings already:
topic_model.visualize_document_datamap(docs, reduced_embeddings=reduced_embeddings)
Or if you want to save the resulting figure:
fig = topic_model.visualize_document_datamap(docs, reduced_embeddings=reduced_embeddings)
fig.savefig("path/to/file.png", bbox_inches="tight")
Source code in bertopic\plotting\_datamap.py
17 18 19 20 21 22 23 24 25 26 27 28 29 30 31 32 33 34 35 36 37 38 39 40 41 42 43 44 45 46 47 48 49 50 51 52 53 54 55 56 57 58 59 60 61 62 63 64 65 66 67 68 69 70 71 72 73 74 75 76 77 78 79 80 81 82 83 84 85 86 87 88 89 90 91 92 93 94 95 96 97 98 99 100 101 102 103 104 105 106 107 108 109 110 111 112 113 114 115 116 117 118 119 120 121 122 123 124 125 126 127 128 129 130 131 132 133 134 135 136 137 138 139 140 141 142 143 144 145 146 147 148 149 150 151 152 153 154 155 156 157 158 159 160 161 162 163 164 165 166 167 168 169 170 171 172 173 174 175 176 177 178 179 180 181 182 183 184 185 186 187 188 | |